The graph below shows the number of tourists visiting a particular Caribbean island between 2010 and 2017. Summarise the information by selecting and reporting the main features, and make comparisons where relevant.
Write at least 150 words.

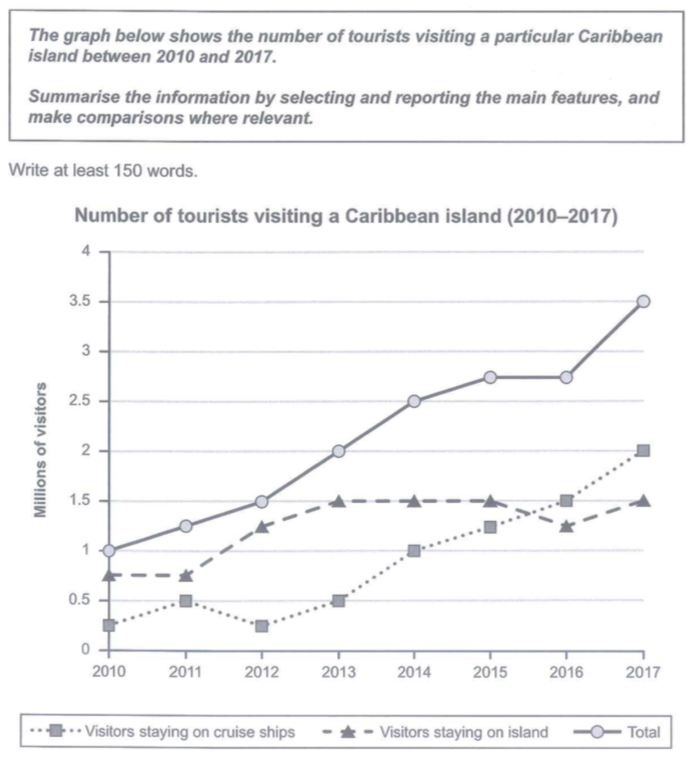
The line graph illustrates the number of tourists who paid a visit to an island in Caribbea over the course of 7 years starting in 2010. Overall, what stands out from the graph is that there was a significant upward trend in the number of visitors to the island over the period. Another notable point is that even though staying on cruise ships was not as popular as staying on the island, the former eventually overtook the later and became the favorite choice of travelers when visiting the island.
Regarding the number of people who stayed on the island during their visit, it started at around 0.75 million people and then levelled off until 2011. After that, there was a gradual rise to 1.5 million people 2 years later and the figure remained stable until 2015. At this point, the number of visitors staying on island saw a slight drop to roughly 1.2 million in 2016 before it recovered back to its 2015 mark by the end of the period.
As for the number of tourists who stayed on cruise ships, it stood at about 1.25 million people in the first year, which was about a third of the figure of people staying on island at the same time. After some slight fluctuations in the first 3 years, the figure climbed significantly, outnumbering the figure for people who stayed on the island by 2015 and reaching its peak at 2 million in the last year.
Looking at the total number of visitors, it experienced a dramatic growth from 1 to approximately 2.75 million people over the first 5 years of the period. After which, the number of tourists to this Caribbean island reached a plateau until 2016 when it soared and peaked at 3.5 million people in 2017.
